------------------------------------------------------------------------ Share or Save this page -------->
REIT Profile by Sector and Subsector
This page presents a profile of the REIT industry including market cap, returns, dividends and closing stock prices. Since REITs are essentially a "real estate play," the data provide some useful insights into the markets' read on the underlying real estate industry. Given the fact most REITs focus on one or two property types, it also suggests how the market percieves the respective sectors. This page provides a graphical look at trends in REIT closing prices through early November 2009. Viewers are referred to NAREIT for more current and detailed data.
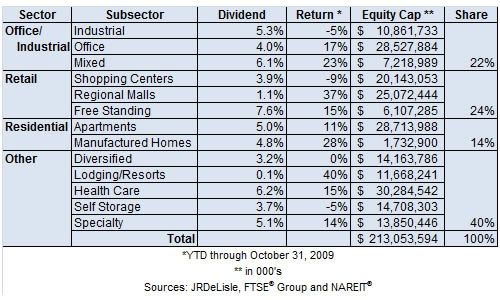
The table presents the annualized dividends, year-to-date returns through October 31 2009, and Equity Capitalization of selected REIT categories.
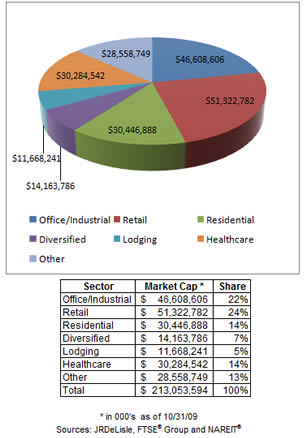
Market Share by Sector
Market Share by Sector
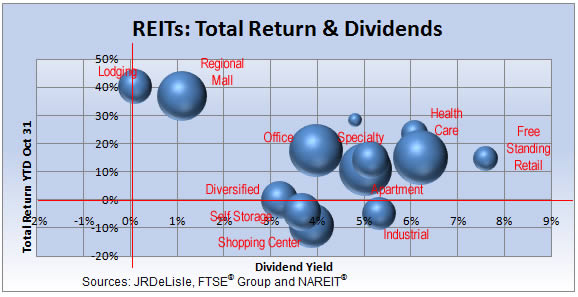
Positioning REITs on Returns & Dividends
Total returns and dividends as of October 31, 2009
The size of the bubbles indicates the relative market capitalization of the respective property sectors in which the various REITs specialize or if they are mixed (i.e., office and industrial) or diversified.
As noted, Lodging and Regional Mall REITs have exhibited the highest returns on a year-to-date basis through October 31, 2009. However, they offered the lowest dividend rates of all REIT sectors. The office, specialty, health care and free standing retail REITs had returns in the mid-teens, with dividends increasing in the samerespective order. Diversified REITs had a nominal total return with dividends averaging 3.2%, while shopping center, self storage and industrial REITs had negative total returns on a year-to-date basis and dividends in the 3-4% range.
Industrial Property Focused REITs
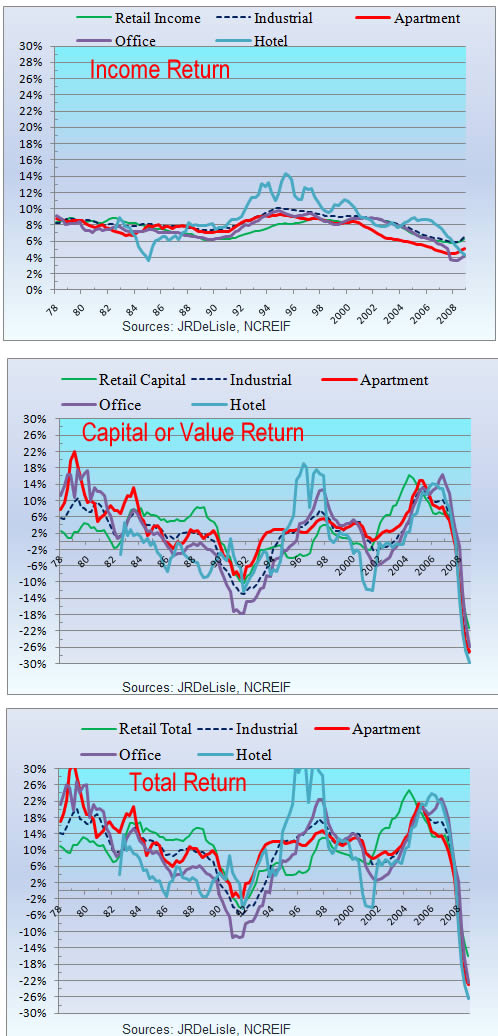
NCREIF Returns through 3Q 2009
NCREIF Commentary
Over the past 12 months, Real Estate Investment Trusts (REITs) prices have been somewhat volatile, echoing the broader stock market. After an early recovery, REITs began posturing to take advantage of the expected turmoil in the commercial market, much as they did in the mid-90s. Memories of the past recovery stage have allowed the REIT industry to raise capital in the face of weakening fundamentals in the underlying real estate market and somewhat disappointing returns. Indeed, through August REITs have raised some $24 billion in new capital, recovering from the 10 year old trough in 2008 but still significantly below the peak prices most experienced in 2006-2007..
Going forward, the extent that REITs will be able to step in and take advantage of the surge in distressed asset listings will depend on a number of factors. For example, in the mid-90s the absence of competition allowed them to buy accretively. In this cycle, they face a competitive wildcard in the growing pool of capital presumably sitting on the sidelines. Regardless of how that plays out, before REITs jump into the fray or take a leadership position, many will have to deal with deteriorating market fundamentals and the lack of capital for refinancing that may force some to focus on their own bottom lines. These will be interesting times indeed, with REITs likely leading the private sector.
Institutional Equity Risk/Returns
NewsFlash
Large & Medium Size Shopping Center REITs
Small and Smaller Shopping Center REITs
Office REITs
e and Medium Apartment REITs
Small Apartment and Hotel REITs
Mixed Property Type and Diversified REITs
I am exploring additional ways to increase my outreach through this website. Please Contact Me
if you have any suggestions as to how I can improve it to address industry issues and help advance the "state of the art" and professional practices.
Disclaimer and Copyright
The materials, views and thoughts expressed on this website represent my personal work; they do not reflect those of the University of Washington or of any of its units. These materials are neither edited nor endorsed by the UW and, as such, should not be so attributed. The materials are designed for academic use and should not be relied on for commercial or business decisions. They are offered in an effort to help enhance the teaching, research and service dimensions of my academic profession and better serve students, colleagues and the broader community. The works of authorship presented in this website and associated materials, may not be reproduced, published, distributed, displayed, transmitted or incorporated in derivative works without proper attribution and approval. The author retains the copyright to these materials and may incorporate them in various publications and outlets in the future. The copyright and restrictions on reproduction of reprinted articles and other materials published by third parties remains in force.