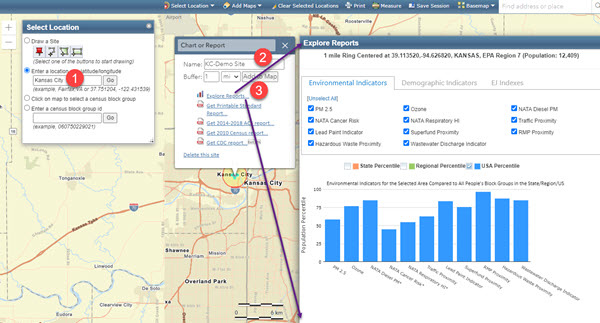
The Environmental Justice Screening and Mapping Tool is a great resource for assessing environmental quality of small geographic areas. Sites can be accessed by address or by interfacing with an interactive map. From the Home Screen, visitors have three choices for starting the exploration. First, they can begin by clicking on Select Location which opens a menu with several options: enter location (i.e., address and/or city)or latitude/longitude coordinates for a specific site. Second, the map can be scrolled in or out and panned to allow the user to select a market and then a census block group. Third, the user can enter the block group ID.
Once a location is selected, the map centers on the city (e.g., Kansas City) and adds an anchor point. The user can stay with that point and select a concentric circle around that point, or can pan and zoom to select a site of interest. Once a site is selected, the user can opt to Generate Reports and the data for the selected area will be displayed.
As an alternative to selecting a point or a block group on the map, a user can use the tools to draw a site or geographic area. This could be done by drawing a trapezoid enfolding a neighborhood or submarket, or using a rectangle tool. Providing even more flexibility, a user can draw a corridor and then establish a buffer area. This corridor can be named and the reports will estimate the statistics for the area of interest. In this case, the Main Street Corridor for which a Streetcar expansion has been scheduled is illustrated. Once the environmental and demographic profiles of the area are reviewed, a user might create trade areas around some of the nodes to help select an optimal site for a particular use.
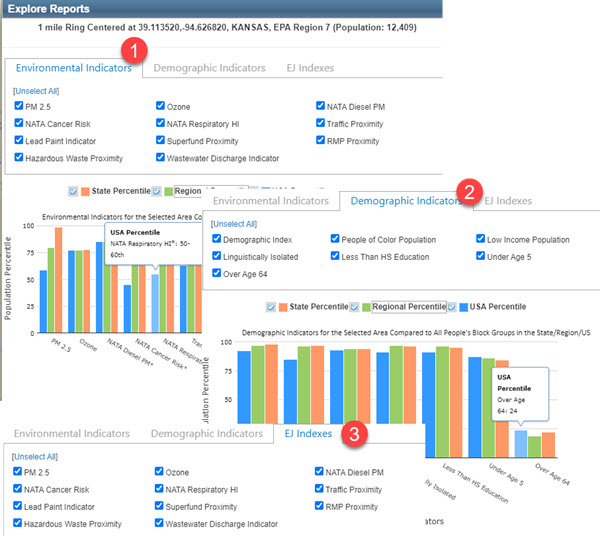
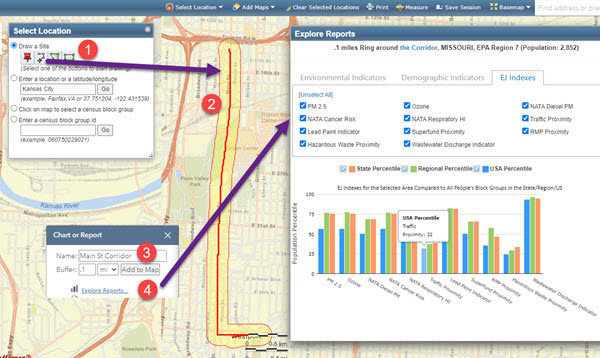 Once the report is produced on-screen, the user can select from three types of reports: environmental indicators, demographic indicators, and EJ indices. By clicking on the comparisons above each graph, the relative ranking of the area to state, regional, and national percentiles are displayed. Mousing over each of the bars reveals a pop-up with actual statistics.
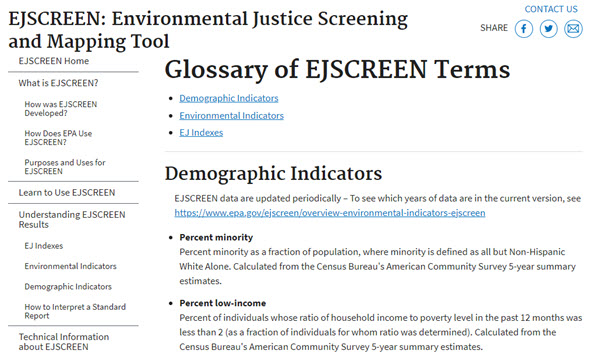
To help users decipher the EJS reports, the EPA created a Glossary of EJSCREEN terms. Users can also download a detailed EJSCREEN User Guide that provides detailed instructions on how to use the site.
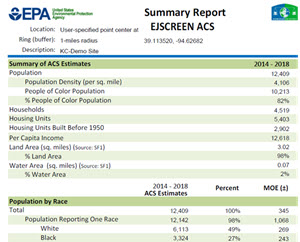
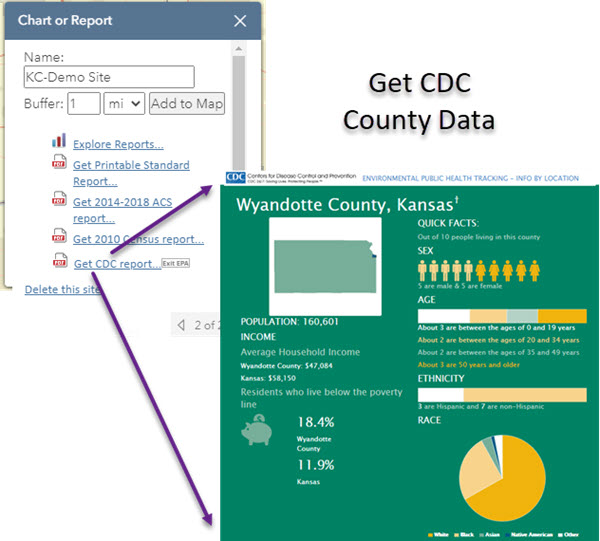
In addition to environmental data, a visitor can select other reports including the American Community Survey Data estimates for the selected area. This report provides information on:
- Summary ACS Statistics
- Population by Race, Sex, and Age
- Population by Educational Attainment
- Populat Age 5+ by Ability to Speak English
- Linquistically Isolated Households
- Households by Income and Tenure
- Employed Population Statistics
- Population by Language Spoken at Home